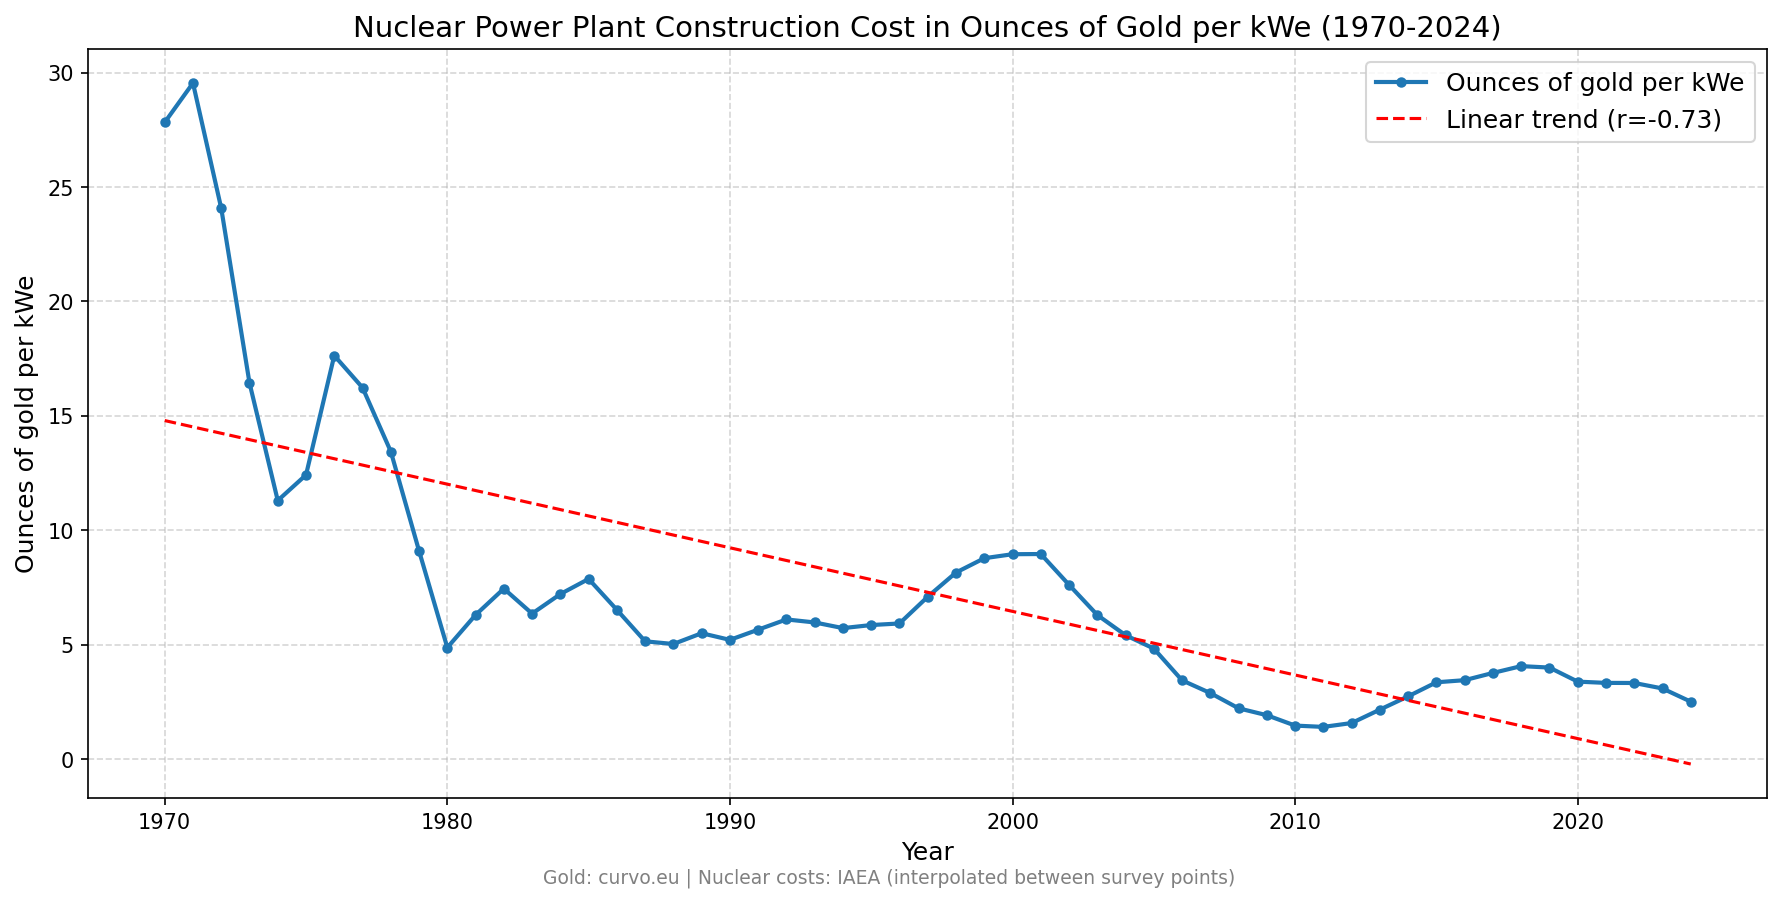
Nuclear Construction Cost is Going Down
Measured in gold, nuclear construction cost follows a clear descent. Relative to available wealth, the required investment is going down.
import numpy as np
import matplotlib.pyplot as plt
from scipy.stats import linregress

# Annual average gold prices USD/troy oz, 1970-2024 (source: curvo.eu)
gold_prices = [
    35.94, 40.62, 58.16, 97.32, 159.26, 161.02, 124.74, 147.84, 193.40, 307.62,  # 1970-1979
    615.00, 460.00, 375.67, 424.35, 360.29, 317.40, 367.66, 446.46, 437.00, 381.44,  # 1980-1989
    383.51, 362.11, 343.82, 359.77, 384.04, 383.79, 387.77, 331.02, 294.24, 278.98,  # 1990-1999
    279.11, 271.04, 309.73, 363.38, 409.72, 444.74, 603.46, 695.39, 871.96, 972.35,  # 2000-2009
    1224.53, 1571.52, 1669.50, 1411.23, 1266.40, 1160.06, 1250.74, 1257.15, 1268.49, 1393.34,  # 2010-2019
    1769.64, 1798.89, 1800.93, 1940.54, 2386.00,  # 2020-2024
]

years = np.arange(1970, 2025)

# Nuclear construction cost USD/kWe (source: IAEA, interpolated between survey points)
nuclear_cost_years = [1970, 1980, 1990, 2000, 2010, 2020]
nuclear_costs =      [1000, 3000, 2000, 2500, 1800, 6000]
nuclear_cost_interp = np.interp(years, nuclear_cost_years, nuclear_costs)

ounces_per_kwe = nuclear_cost_interp / np.array(gold_prices)

slope, intercept, r_value, _, _ = linregress(years, ounces_per_kwe)
trendline = slope * years + intercept

plt.figure(figsize=(12, 6))
plt.plot(years, ounces_per_kwe, marker='o', markersize=4, linestyle='-', linewidth=2, label='Ounces of gold per kWe')
plt.plot(years, trendline, linestyle='--', color='red', label=f'Linear trend (r={r_value:.2f})')

plt.title('Nuclear Power Plant Construction Cost in Ounces of Gold per kWe (1970-2024)', fontsize=14)
plt.xlabel('Year', fontsize=12)
plt.ylabel('Ounces of gold per kWe', fontsize=12)
plt.grid(True, linestyle='--', alpha=0.5)
plt.legend(fontsize=12)

plt.figtext(0.5, 0.01,
    'Gold: curvo.eu | Nuclear costs: IAEA (interpolated between survey points)',
    fontsize=9, color='gray', ha='center')

plt.tight_layout()
plt.savefig('nuclear-construction-cost.png', dpi=150, bbox_inches='tight')